|
Stability (FDA Definition) |
  
|
|
Stability (FDA Definition) |
|
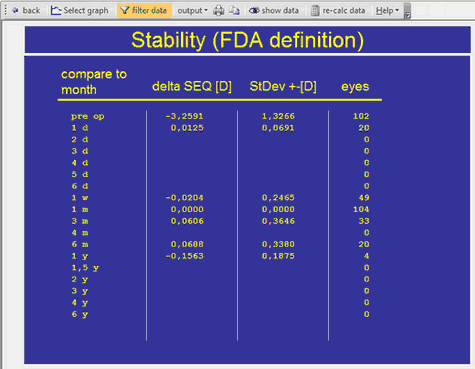
Stability in between two follow up time points according to FDA definitions should be calculated for paired data. Only eyes which have follow up data at both time points will be included.
Below an example where the first time point is set to 1 month --> values for delta SEQ and StDev will be zero. Between 1 month and 1 year a regression of -0.15 D occurred.
Note: there may be discrepancies between the classical stability graph and this table because only paired data sets are accepted.