|
Stability |
  
|
|
Stability |
|
Attempted - Achieved Spherical Equivalent over Time Graph
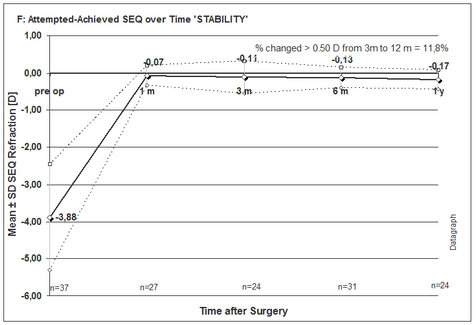
This graph shows the attempted vs. achieved change in refraction as average spherical equivalent (SEQ = SPH+CYL/2). Base is the subjective ('manifest') pre and postOP refraction.
If the target refraction was different from plano (as in Monovision cases for example), they will at the horizontal axis (0), if the target refraction has been achieved.
The dashed lines indicate ±1 standard deviation (Stdev) of the distribution of the individual values. At the bottom of the graph, the number of eyes per follow up interval is given. (n=xx)
According to journal requirements, the percentage of eyes which changed their refraction by more than 0.5 D between month 3 and month 12 is shown separately in the top right part of the graph.
Note: By default, this graph displays only data from 0-1-3-6-9 and 12 month. You may change the filter setting by clicking 'Filter data' and selecting/deselecting other follow up time intervals in the 'month' area of the filter pop up window using the 'ctrl' key and left mouse button.