|
Attempted vs. Achieved change in CYL |
  
|
|
Attempted vs. Achieved change in CYL |
|
Similar to the 'Attempted vs. Achieved change in Spherical Equivalent' graph, this scatter plot shows the attempted change in cylinder magnitude vs. the achieved change in magnitude, based on vector calculation.
Any data point blow the 45° line reflects an eye with cylinder undercorrection and all dots above represent an cylinder overcorrection.
Data points below the horizontal axis represent eyes with induced astigmatism.
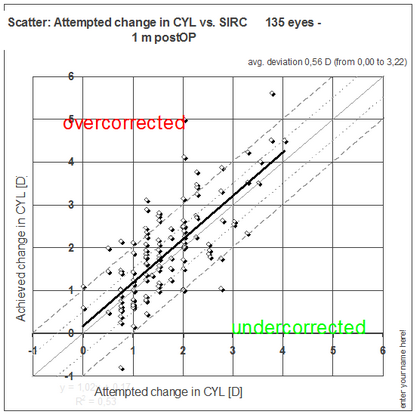
Note: More data points may exist outside the visible range and can be seen only in the edit mode of MS Graph.