|
Astigmatism Analysis |
  
|
|
Astigmatism Analysis |
|
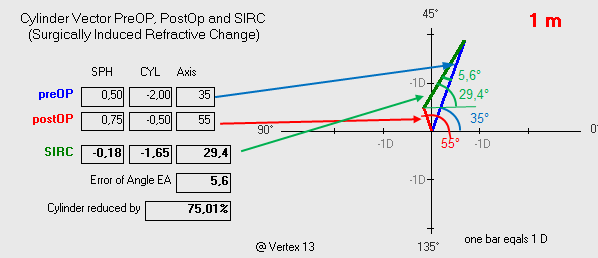
Datagraph-med uses vector analysis to calculate the surgically induced refractive change (SIRC), taking into account any cylinder axis change. This calculation is done for each follow up exam individually and can be seen on the astigmatism tab of the data entry form.
The double angel vector pictogram area corresponds to the selected follow up time interval. (click FU line in the table above)
The blue line indicates the preOP cylinder and axis value, the red line the postOP cylinder and axis. The surgically induced change in cylinder is represented by the green line. The corresponding axis values can be seen in the graph below. Note this is a double angle plot, spreading 180 ° to a full circle.