|
Cylinder Magnitued over Time |
  
|
|
Cylinder Magnitued over Time |
|
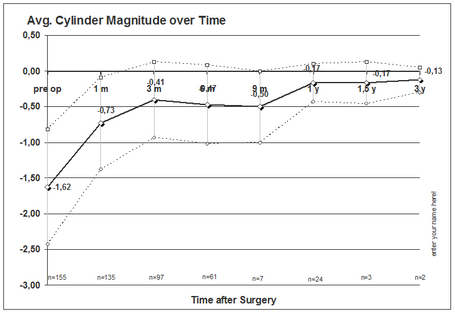
The graph 'avg. cylinder magnitude over time' plots the mean cylinder magnitude at each follow up interval including +- 1 Stdev. It ignores the vectorial (axis) changes and simply shows the presence of astigmatism.
Note: It does not allow to differentiate between under or overcorrection and is incorrect if your data set contains cylinder overcorrection cases.