|
Percentage within Attempted |
  
|
|
Percentage within Attempted |
|
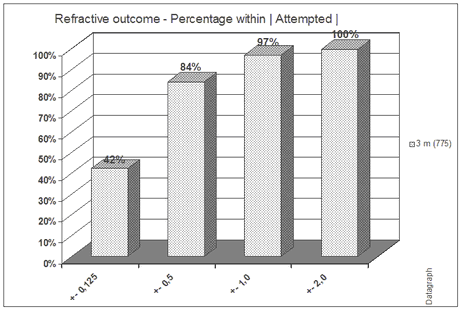
Refractive Outcome shows the percentage of patients which are within a certain range of spherical equivalent of attempted correction.
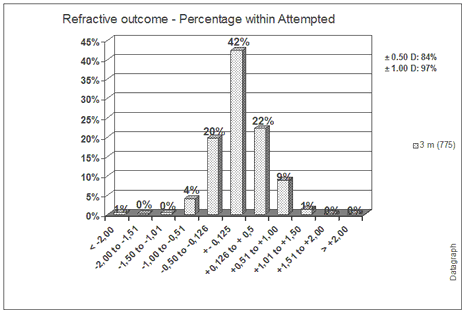
You may display the results for one or more follow up points at the same time.
Alternatively to the graph above the same data can be shown cumulative and regardlessly the sign of the residual refractive error.