|
Filter Settings for Graphs |
  
|
|
Filter Settings for Graphs |
|
Data, which is actually shown on individual graphs, can specified via the 'Data Filter Settings' pop-up window which appears after clicking the 'Filter Data' icon in the ribbon bar. There are four fixed filter criteria ('month', 'groups', 'refraction type', and 'surgery type' - marked in yellow) and four additional optional filter criteria boxes (marked in light-blue). Each of the optional filter boxes contains a drop down list of field names, which can be used to narrow down the amount of data to be included in the actual graph.
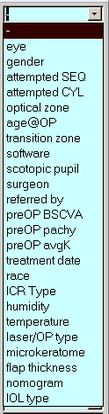
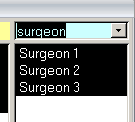
Currently (Version 5.30) there are 24 selectable filters. Once you have chosen an optional filter field, you will see a list of parameters, which depend on the content of your database.
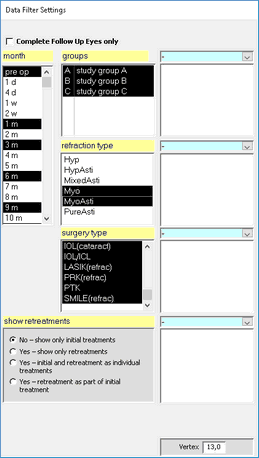
'Complete Follow Up Eyes only': The selections under 'month' depend on the current graph. All 'over time' graphs allow multiple selections (using Mouse + 'Strg'-Key) and can be further specified to show only eyes which have data on all selected follow up intervals.
'Show Retreatments': Usually only primary treatments are displayed. Re-treatments can be shown separately, as individual treatment together with initial treatments or as part of the initial treatment.
Note: More filter options may appear, depending on the selected graph. Trendline options will be available for all scatter plots. All wavefront based graphs have additional fields for wavefront type and pupil diameter.